Showing posts with label and. Show all posts
Showing posts with label and. Show all posts
Thursday, January 9, 2014
Simple 15V And 5V Car Battery Supply Circuit Diagram
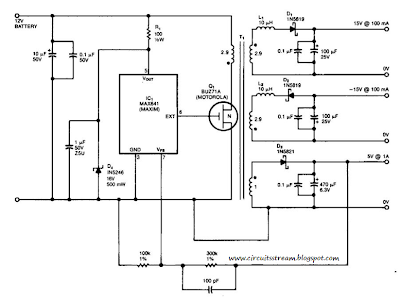
This is a Simple 15V And 5V Car Battery Supply Circuit Diagram. In this circuit use IC1 is a switching regulator that generates a 45-kHz signal that drives the gate of MOSFET Ql. Dl, D2, and D3 are Schottky diodes. The 5-V output is sensed as a reference; feedback to the chip turns off the gate signal to Ql if the voltage rises above 5 V.
Tl has Trifilar windings that assume about 2% regulation for a 10-to 100-mA load change on the ± 15-V supplies. R1/D4 provide over-voltage protection. Tl has a primary inductance of about 21 . Core size should allow 4-A peak currents. The turn ratios are IIV2 turns each for the 15-V supplies, ll1/2 turns for the primary, and four turns for the 5-V secondary. The efficiency is about 75%.
Simple 15V And 5V Car Battery Supply Circuit Diagram

Friday, December 20, 2013
Warning Light and Marker Light Circuit Diagram
This is a Warning Light and Marker Light Circuit Diagram. A flashing light of high brightness and short duty cycle is often desired to provide maximum visibility and battery life. This necessitates using an output transistor, which can supply the cold filament surge current of the lamp while maintaining a low saturation voltage. The oscillation period and flash duration are determined in the feedback loop, while the use of a photo transistor sensor minimizes sensitivity variations.
Warning Light and Marker Light Circuit Diagram

Tuesday, September 10, 2013
3khz Low Pass Filter and Audio Amplifier Circuit Diagram
This circuit uses a switched capacitor filter IC from National Semiconductor to filter signals with frequencies higher than the 3KHz needed for voice audio. The schematic includes an audio amplifier that is designed to drive a standard audio head phone.
The circuit is described in more detail in the receiver section of Dave Johnsons Handbook of Optical Through the Air Communications.(this link is off-site)
3khz Low Pass Filter and Audio Amplifier Circuit Diagram

Sunday, September 1, 2013
2 4GHz WiFi ISM Band Scanner Firmware and Sowtware Part 2
2.4GHz WiFi & ISM Band Scanner. Description and Schematic Part 1
PIC Firmware
The firmware running on the PIC18F2550 was written for the CCS C compiler and uses the CCS USB protocol stack, which in turn appears to be derived from Microchip code. At the top level it is quite simple, it just repeatedly steps through the frequency range taking readings.
For each frequency it takes repeated readings until it gets what seems to be a consistent value. It then saves that value and moves on to the next frequency. When it has finished running through the band it sends off all readings to the computer over the USB. The CYWUSB6935 chip steps 1MHz at a time and the band is 85MHz wide, so the number of readings sent to the computer is 85. Despite the repeated measurements needed to get a consistent reading the chip achieves quite a good performance, about 4 complete spectrum scans every second.
The firmware and source code for the 18F2550 is available from the download section below.
Windows Software
The software running on the computer was written in Visual Basic 5. It is not particularly sophisticated, for example it keeps polling the USB interface to see if new data has arrived and that uses up a lot of CPU time. But, you dont generally use the scanner for a lot of time and you would not normally be running computer games at the same time, so this inefficiency is not of great importance.
The software on the computer saves the set of readings into an array. When it comes to drawing the spectrum display on the screen it steps through all the saved readings for each frequency looking for the highest reading, and it is that highest reading that it draws on the screen for that frequency. As a new reading is received the oldest reading in the array is discarded. The slider on the screen controls how many readings are saved for each frequency, the default is 350 readings which represents about 90 seconds of data.
All this means that the delay has a "memory" and one high reading will hang around for 90 seconds until it is flushed out. This is done because devices normally hop around in frequency and it would be hard to see what frequencies were popular unless there was some way of holding on to the reading for a while. You can see this in action when there is a noise spike. That spike would remain on the screen for (say) 90 seconds then disappear. But a device that communicated on that frequency (amongst others) would in most probability revisit that frequency within the 90 second period and that would place a new high value into the array of values for that frequency.
By adjusting the slider you control the size of this array and consequently the amount of time that it would take to flush a reading out. Smaller numbers flush more quickly, larger ones take more time. You can pause the display by clicking on the Pause button. Clicking on it again will clear the array and start a new collection. This is also a handy way of clearing everything to restart with a fresh display.
The Export button will export the current set of readings to a .csv file which can be loaded into a spreadsheet like Excel.
As usual, the software and source code is available for download below.
C# Version of the Software
A reader, Jim McCullers in the USA, took up the challenge of porting the desktop software to a more modern environment. The code he wrote compiles under Microsoft Visual C# 2010 Express (the free version) and is also available for download below.
He did not make any major changes to the structure or look but created a new version of the MPUSBAPI to suit C# and made it into a class. The mpusbapi.dll module must be in the same directory folder as the executable so you will notice that he has copies in both the debug and release folders.
Plugging It In
Because the scanner uses standard USB it can be connected to any computer, although the software is written only for Windows XP, Vista and Windows 7.
Before you plug the scanner in you must install the software first. This is available in the download section below. Failure to install the software first will result in Windows identifying the scanner as an "Unidentified Device".
During installation of the software a device driver is installed and it is this that helps Windows identify the scanner. After you have correctly installed the software and plugged in the scanner you should see the device show up under "Other Devices" in Device Manager as shown on the left.
When you fire up the desktop software (ISMScanner.exe) you should see the message in the software window stating "Connected to Geoffs 2.4GHz Scanner". If you get "Scanner not found" then the scanner is not plugged in or not working.
The firmware running on the PIC18F2550 was written for the CCS C compiler and uses the CCS USB protocol stack, which in turn appears to be derived from Microchip code. At the top level it is quite simple, it just repeatedly steps through the frequency range taking readings.
For each frequency it takes repeated readings until it gets what seems to be a consistent value. It then saves that value and moves on to the next frequency. When it has finished running through the band it sends off all readings to the computer over the USB. The CYWUSB6935 chip steps 1MHz at a time and the band is 85MHz wide, so the number of readings sent to the computer is 85. Despite the repeated measurements needed to get a consistent reading the chip achieves quite a good performance, about 4 complete spectrum scans every second.
The firmware and source code for the 18F2550 is available from the download section below.
Windows Software
The software running on the computer was written in Visual Basic 5. It is not particularly sophisticated, for example it keeps polling the USB interface to see if new data has arrived and that uses up a lot of CPU time. But, you dont generally use the scanner for a lot of time and you would not normally be running computer games at the same time, so this inefficiency is not of great importance.
The software on the computer saves the set of readings into an array. When it comes to drawing the spectrum display on the screen it steps through all the saved readings for each frequency looking for the highest reading, and it is that highest reading that it draws on the screen for that frequency. As a new reading is received the oldest reading in the array is discarded. The slider on the screen controls how many readings are saved for each frequency, the default is 350 readings which represents about 90 seconds of data.
All this means that the delay has a "memory" and one high reading will hang around for 90 seconds until it is flushed out. This is done because devices normally hop around in frequency and it would be hard to see what frequencies were popular unless there was some way of holding on to the reading for a while. You can see this in action when there is a noise spike. That spike would remain on the screen for (say) 90 seconds then disappear. But a device that communicated on that frequency (amongst others) would in most probability revisit that frequency within the 90 second period and that would place a new high value into the array of values for that frequency.
By adjusting the slider you control the size of this array and consequently the amount of time that it would take to flush a reading out. Smaller numbers flush more quickly, larger ones take more time. You can pause the display by clicking on the Pause button. Clicking on it again will clear the array and start a new collection. This is also a handy way of clearing everything to restart with a fresh display.
The Export button will export the current set of readings to a .csv file which can be loaded into a spreadsheet like Excel.
As usual, the software and source code is available for download below.
C# Version of the Software
A reader, Jim McCullers in the USA, took up the challenge of porting the desktop software to a more modern environment. The code he wrote compiles under Microsoft Visual C# 2010 Express (the free version) and is also available for download below.
He did not make any major changes to the structure or look but created a new version of the MPUSBAPI to suit C# and made it into a class. The mpusbapi.dll module must be in the same directory folder as the executable so you will notice that he has copies in both the debug and release folders.
Plugging It In
Because the scanner uses standard USB it can be connected to any computer, although the software is written only for Windows XP, Vista and Windows 7.
Before you plug the scanner in you must install the software first. This is available in the download section below. Failure to install the software first will result in Windows identifying the scanner as an "Unidentified Device".
During installation of the software a device driver is installed and it is this that helps Windows identify the scanner. After you have correctly installed the software and plugged in the scanner you should see the device show up under "Other Devices" in Device Manager as shown on the left.
When you fire up the desktop software (ISMScanner.exe) you should see the message in the software window stating "Connected to Geoffs 2.4GHz Scanner". If you get "Scanner not found" then the scanner is not plugged in or not working.

Downloads
Firmware - HEX programming file v1.0, Firmware - source code v1.0 - download
Windows software v1.0 Installation (Visual Basic Version), Windows software v1.0 Source code (C# Version), Windows software v1.0 Source code (Visual Basic Version), Windows driver for Vista and Win 7 32/64 bit systems - download
Friday, August 30, 2013
Simple SWR and PWR Meter
Many SWR / Power meter used by amateurs to the extent reasonably accurate continuous average power with a CW key-down signal, but can not reliably be used with other (modulated) signals PEP or average power measurement. These laws seek to show why the power measurement can be a sensitive issue, and because the interpretation of a yardstick of power can be a lot of attention and knowledge of construction and the characteristics of the instrument.
A reflectometer-type SWR meter can be calibrated to give power back and forth (PF, Pr) on a power supply. A classic example is the 1943 Bird Series power meter, which is a directional coupler is used to obtain a sample voltage proportional to the voltage wave or forward or backward on the feeder (VF, VR). Other systems, perhaps more suitable for HF, then use a bridge circuit to perform the same function.
Simple SWR and PWR Meter Circuit diagram
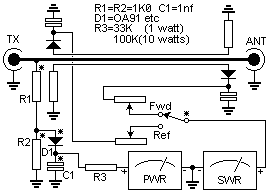
The sample voltage is then rectified and displayed on a meter that is calibrated in watts. If the counter is typically a coil, the scale, so the numbers on the scale, representing the power, are proportional to the square of the applied voltage or the current calibration. The theory of this type is very simple and is based on the concept represented by PF = Vf2/Zo. Note that if the power supply has an impedance that differs from the value of how the instrument is calibrated, there will be a mistake. The output voltage of the rectifier is a solid phase of VF or VR, and this is expected in the calibration of the meter.
Examples of directional coupling, and bridge-type reflectometers are shown in Figures 1 and 2, while the bird directional coupler means 43 is illustrated in Figure 3. Note that in all cases the measurement circuit, a combination with a small RC time constant, making the system unsuitable for the measurement of PEP, and the absence of a specific device quadratic, making them unsuitable for measuring the average power .
A reflectometer-type SWR meter can be calibrated to give power back and forth (PF, Pr) on a power supply. A classic example is the 1943 Bird Series power meter, which is a directional coupler is used to obtain a sample voltage proportional to the voltage wave or forward or backward on the feeder (VF, VR). Other systems, perhaps more suitable for HF, then use a bridge circuit to perform the same function.
Simple SWR and PWR Meter Circuit diagram
The sample voltage is then rectified and displayed on a meter that is calibrated in watts. If the counter is typically a coil, the scale, so the numbers on the scale, representing the power, are proportional to the square of the applied voltage or the current calibration. The theory of this type is very simple and is based on the concept represented by PF = Vf2/Zo. Note that if the power supply has an impedance that differs from the value of how the instrument is calibrated, there will be a mistake. The output voltage of the rectifier is a solid phase of VF or VR, and this is expected in the calibration of the meter.
Examples of directional coupling, and bridge-type reflectometers are shown in Figures 1 and 2, while the bird directional coupler means 43 is illustrated in Figure 3. Note that in all cases the measurement circuit, a combination with a small RC time constant, making the system unsuitable for the measurement of PEP, and the absence of a specific device quadratic, making them unsuitable for measuring the average power .
Subscribe to:
Posts (Atom)