Friday, December 27, 2013
5 LED VU meter circuit diagram using KA2284
Circuit Diagram:
 |
| Fig: 5-LED Dot/Bar (VU meter) circuit diagram |
Usability of this circuit:
- AC signal Meter or DC Level meter.
- Audio VU(Volume Unit) meter in amplifier or such kind of device.
Further reading: DOT vs BAR

Thursday, September 26, 2013
ESR Low Resistance Test Meter
As electrolytic capacitors age, their internal resistance, also known as "equivalent series resistance" (ESR), gradually increases. This can eventually lead to equipment failure. Using this design, you can measure the ESR of suspect capacitors as well as other small resistances. Basically, the circuit generates a low-voltage 100kHz test signal, which is applied to the capacitor via a pair of probes. An op amp then amplifies the voltage dropped across the capacitor’s series resistance and this can be displayed on a standard multimeter. In more detail, inverter IC1d is configured as a 200kHz oscillator.
Its output drives a 4027 J-K flipflop, which divides the oscillator signal in half to ensure an equal mark/space ratio. Two elements of a 4066 quad bilateral switch (IC3c & IC3d) are alternately switched on by the complementary outputs of the J-K flipflop. One switch input (pin 11) is connected to +5V, whereas the other (pin 8) is connected to -5V. The outputs (pins 9 & 10) of these two switches are connected together, with the result being a ±5V 100kHz square wave. Series resistance is included to current-limit the signal before it is applied to the capacitor under test via a pair of test probes. Diodes D1 and D2 limit the signal swing and protect the 4066 outputs in case the capacitor is charged.
Circuit diagram:
 ESR & Low Resistance Test Meter Circuit Diagram
A second pair of leads sense the signal developed across the probe tips. Once again, the signal is limited by diodes (D3 & D4) before begin applied to the remaining two inputs of the 4066 switch (pins 2 & 3 of IC3a & IC3b). These switches direct alternate half cycles to two 1μF capacitors, removing most of the AC component of the signal and providing a simple "sample and hold" mechanism. The 1μF capacitors charge to a DC level that is proportional to the test capacitor’s ESR. This is differentially amplified by op amp IC4 so that it can be displayed on a digital multimeter – 10Ω will be represented by 100mV, 1Ω by 10mV, etc. To calibrate the circuit, first adjust VR1 to obtain 100kHz at TP3.
Next, momentarily short the test probes together and adjust VR4 for 0mV at pin 6 of IC4. That done, set your meter to read milliamps and connect it between TP4 and the negative (-) DMM output. Apply -5V to TP2 and note the current flow, which should be around 2.1mA. Transfer the -5V from TP2 to TP1 and adjust VR2 until the same current (ignore sign) is obtained. Remove the -5V from TP1. Again, set to your meter to read volts and connect it to the DMM outputs. Apply the probes to a 10W resistor and adjust VR3 for a reading of 100mV. Finally, ensure that all capacitors to be tested are always fully discharged before connecting the probes.
Author: Len Cox - Copyright: Silicon Chip Electronics
Tuesday, September 3, 2013
Linear Resistance Meter Circuit

Most linear scale resistance meters including the present design, work on the principle that if a resistance is fed from a constant current source the voltage developed across that resistance is proportional to its value. For example, if a 1K resistor is fed from a 1 mA current source from Ohm’s Law it can be calculated that 1 volt will be developed across the resistor (1000 Ohms divided by 0.001 amps = 1 volt). Using the same current and resistance values of 100 ohms and 10K gives voltages of 0.1volts (100 ohms / 0.001amps = 0.1volts) and 10 volts (10000 ohms / 0.001amps = 10 volts).
Thus the voltage developed across the resistor is indeed proportional to its value, and a voltmeter used to measure this voltage can in fact be calibrated in resistance, and will have the desired forward reading linear scale. One slight complication is that the voltmeter must not take a significant current or this will alter the current fed to the test resistor and impair linearity. It is therefore necessary to use a high impedance voltmeter circuit.
The full circuit diagram of the Linear Resistance Meter is given in Figure 1. The constant current generator is based on IC1a and Q1. R1, D1 and D2 form a simple form a simple voltage regulator circuit, which feeds a potential of just over 1.2 volts to the non-inverting input of IC1a. There is 100% negative feedback from the emitter of Q1 to the inverting input of IC1a so that Q1’s emitter is stabilised at the same potential as IC1a’s non-inverting input. In other words it is stabilised a little over 1.2 volts below the positive supply rail potential. S3a gives 5 switched emitter resistances for Q1, and therefore 5 switched emitter currents. S3b provides 5 reference resistors across T1 & T2 via S2 to set full-scale deflection on each range using VR1.
As the emitter and collector currents of a high gain transistor such as a BC179 device used in the Q1 are virtually identical, this also gives 5 switched collector currents. By having 5 output currents, and the current reduced by a factor of 10 each time S3a is moved one step in a clockwise direction, the 5 required measuring ranges are obtained. R2 to R6 must be close tolerance types to ensure good accuracy on all ranges. The high impedance voltmeter section uses IC1b with 100% negative feedback from the output to the inverting input so that there is unity voltage gain from the non-inverting input to the output. The output of IC1b drives a simple voltmeter circuit using VR1 and M1, and the former is adjusted to give the correct full-scale resistance values.
The CA3240E device used for IC1 is a dual op-amp having a MOS input stage and a class A output stage. These enable the device to operate with the inputs and outputs right down to the negative supply rail voltage. This is a very helpful feature in many circuits, including the present one as it enables a single supply rail to be used where a dual balanced supply would otherwise be needed. In many applications the negative supply is needed simply in order to permit the output of the op-amp to reach the 0volt rail. In applications of this type the CA3240E device normally enables the negative supply to be dispensed with.
As the CA3240E has a MOS input stage for each section the input impedance is very high (about 1.5 million Megohms!) and obviously no significant input current flows into the device. This, together with the high quality of the constant current source, and the practically non-existent distortion through IC1b due to the high feedback level gives this circuit excellent linearity.
With no resistor connected across T1 & T2 M1 will be taken beyond full-scale deflection and overloaded by about 100 or 200%. This is unlikely to damage the meter, but to be on the safe side a push-to-test on/off switch (S1) is used. Thus the power is only applied to the circuit when a test resistor is connected to the unit, and prolonged meter overloads are thus avoided.
A small (PP3 size) 9 volt battery is a suitable power source for this project which has a current consumption of around 5mA and does not require a stabilised supply.


e-mail: portagepal@tiscali.co.uk
Source: http://www.electronics-lab.com
Friday, August 30, 2013
Simple SWR and PWR Meter
A reflectometer-type SWR meter can be calibrated to give power back and forth (PF, Pr) on a power supply. A classic example is the 1943 Bird Series power meter, which is a directional coupler is used to obtain a sample voltage proportional to the voltage wave or forward or backward on the feeder (VF, VR). Other systems, perhaps more suitable for HF, then use a bridge circuit to perform the same function.
Simple SWR and PWR Meter Circuit diagram
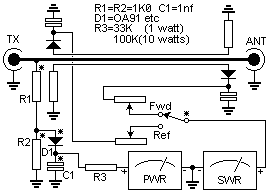
The sample voltage is then rectified and displayed on a meter that is calibrated in watts. If the counter is typically a coil, the scale, so the numbers on the scale, representing the power, are proportional to the square of the applied voltage or the current calibration. The theory of this type is very simple and is based on the concept represented by PF = Vf2/Zo. Note that if the power supply has an impedance that differs from the value of how the instrument is calibrated, there will be a mistake. The output voltage of the rectifier is a solid phase of VF or VR, and this is expected in the calibration of the meter.
Examples of directional coupling, and bridge-type reflectometers are shown in Figures 1 and 2, while the bird directional coupler means 43 is illustrated in Figure 3. Note that in all cases the measurement circuit, a combination with a small RC time constant, making the system unsuitable for the measurement of PEP, and the absence of a specific device quadratic, making them unsuitable for measuring the average power .